PT | EN

Respect for the environment is a fundamental value of ENGIE Brasil Energia. Besides the rational consumption of natural resources, the Company adopts the practice of identifying the environmental impacts and aspects arising from its activities, establishing for the purpose monitoring and control programs and initiatives. GRI G4-14

NBR ISO 14001 certification of 14 plants contributes to the continual improvement of the Company’s environmental management. In 2016, Estreito Hydroelectric Plant was awarded certification, joining a group of a further eight hydroelectric plants, two thermoelectrics and one biomass-fired plant. The certified plants together now account for 96.0% of the Company’s installed capacity and are responsible for 96.7% of net energy generation.


Certified plants - NBR ISO 14001

HydroelectricThermoelectricBiomass
  • Estreito 
  • São Salvador 
  • Cana Brava 
  • Itá 
  • Machadinho 
  • Passo Fundo 
  • Ponte de Pedra 
  • Salto Osório 
  • Salto Santiago 
  • William Arjona 
  • Jorge Lacerda Thermoelectric Complex
  • Lages Co-generation Unit

At the end of 2016, all these same plants were recertified according to NBR ISO 14001, NBR ISO 9001 (quality) and OHSAS 18001 (occupational health and safety) standards by Bureau Veritas Certification.

The Company sets annual management goals for the environmental aspects and impacts identified as the most critical for all certified units. By the end of 2016, 61.5% of the 109 environmental goals set for the year were achieved while a further 17.4% were pending completion.

Targets are based on specific environmental performance indicators and are continually monitored by the Company. Targets include aspects relating to management of the biodiversity, consumption of natural resources, disposal of waste and greenhouse gas emissions, among others.

Legal compliance

All plants operated by ENGIE Brasil Energia have the environmental authorizations and licenses required by the current legislation. The Company monitors permanently changes in laws, standards and resolutions regulating its activities, adjusting operations and procedures whenever necessary to ensure legal conformity throughout the generator complex as well as projects in the process of installation.

In 2016, the operational licenses of three plants in the Jorge Lacerda Thermoelectric Complex (CTJL) and the license for the Mineral Coal Terminal in the same complex, the Ibitiúva Bioenergética Thermoelectric Plant and two transmission lines linking the Trairi Wind Complex were all renewed. In addition, the Preliminary License (PL) for the Norte Catarinense Thermoelectric Power Plant was issued and the Operational License (OL) renewed for withdrawing, piping and treating water for the industrial supply of the Lages Co-Generation Plant.

Biodiversity GRI G4-EU13

The influence of the Company’s activities on the biodiversity varies with type of operation and local environmental conditions. In 2016, ENGIE Brasil Energia launched a project for ascertaining adequate identification of this influence and establishing the status of the biodiversity in the context of the area surrounding the plants comprising the generator complex.

Known as the Biodiversity Matrix, the project was based on benchmarking of electric sector companies. In addition to evaluating the sustainability policies of these organizations, the analysis was instrumental in identifying good risk management practices and measures for mitigating impacts on the biodiversity. Nine parameters were then selected and characterized for evaluating the biodiversity. The parameters are based on national guidelines for classification and prioritization and are available and recognized in the regional, national and international context (see box).

1 O projeto Matriz Biodiversidade tem como objetivo suprir a necessidade de uma identificação mais precisa e padronizada dos impactos sobre a biodiversidade, visto que as informações constantes em estudos realizados à época de implantação de empreendimentos mais antigos podem não mais corresponder à realidade. GRI G4-EN12


Parameters - Biodiversity Matrix

  • Biomass 

  • Phytoecological Regions

  • Conservation Units

  • Indigenous Land

  • Priority Areas for Conservation, Sustainable Use and Sharing the Benefits of the Brazilian Biodiversity

  • Important Bird Areas – IBAs

  • Migratory Bird Routes and Areas of Concentration

  • Wetlands of International Importance – RAMSAR Sites

  • UNESCO World Heritage


All the information and spatial bases compiled in the scope of the project are being processed in a Geographical Information System (SIG). This will facilitate specific consultations on the catchment areas of 26 operations comprising the generator complex.

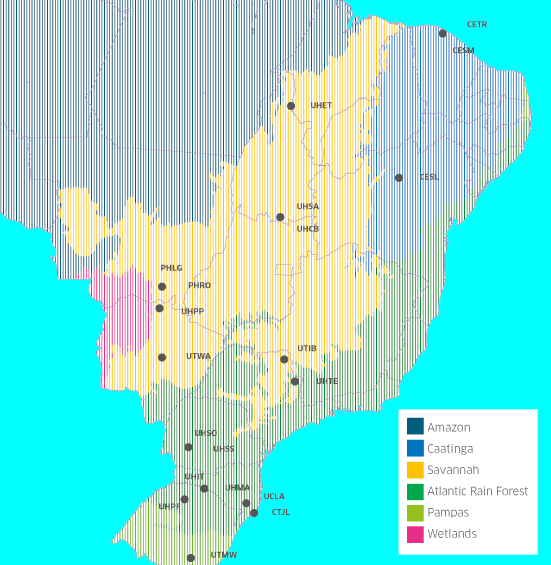
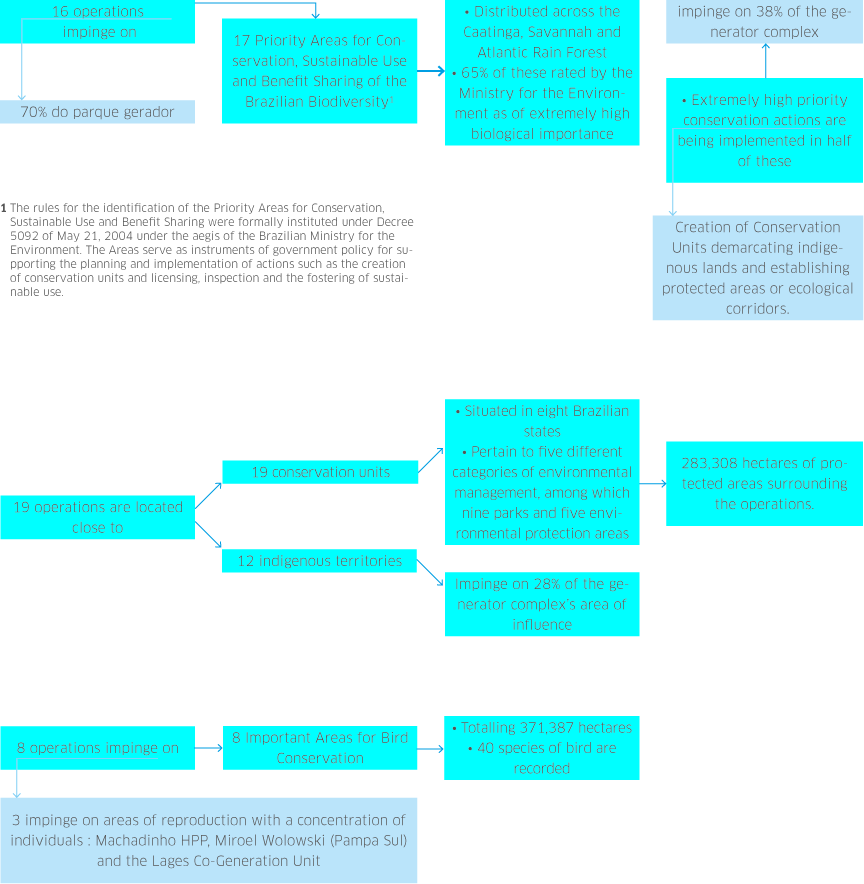
Biodiversity Matrix Project – Insertion of the operations in the Brazilian biomass GRI G4-EN12, G4-EN13, G4-EN14

Biodiversity Matrix > Preliminary Results - 2016

The first stage of the project to be concluded in 2017 will ensure the regional biodiversity of each operation is understood, allowing a more precise analysis and the setting of priority actions. ENGIE Brasil Energia will then be able to prepare and execute environmental programs focused on habitats or species of greater importance for conservation, in line with local realities. In addition, the expertise generated by the project will pave the way for the development of strategies in partnership with other companies, environmental protection agencies, teaching and research institutions and other entities, which share an interest in preserving the regions involved.

Key actions

Hydroelectric plants

The construction of a hydroelectric power plant results in the conversion of an aquatic habitat into a lentic environment (reservoirs create a standing water effect). While this process is taking place, changes occur in the physical-chemical characteristics of water resources. This has a direct effect on the aquatic biodiversity, more especially the ichthoyfauna (a wide spectrum of fish species inhabiting a given geographic region). Some species find the new environment conducive to their survival and reproduction, although others are unable to adapt to the new conditions. In order to assess this process over time, ENGIE Brasil Energia has been investing in R&D projects and monitoring the ichthyofauna in the regions of the hydroelectric plants it operates. The Company also promotes the periodic release of fish fries (newly hatched fish) into the reservoirs with a view to restocking them with native species. Em 2016, for example 550 fish of the dorado and the grumatã species were released into the Uruguay River in the catchment area of the Itá and Machadinho hydroelectric power plants.

Another impact arising from the installation of a hydroelectric plant is the loss of habitat resulting from flooding during the reservoir filling process. In the course of this process, ENGIE Brasil Energia recovers and relocates stranded fauna and flora from areas where brush has been cleared to alternative areas in keeping with their original habitat. Once the reservoir is filled, the Company is responsible for the creation of a permanent preservation area and for the restoration of areas degraded by construction.

Complementary to these activities, ENGIE Brasil Energia cultivates, plants and donates native forest seedlings to local communities. In 2016, 340,269 seedlings were planted and donated in regions surrounding the plants.

Thermoelectric plants

During the year, ENGIE Brasil Energia continued construction work at the Pampa Sul TPP in Candiota (RS). In 2015, the Company introduced its Vegetal Germplasm Recovery Subprogram for preserving the regional biome through the recovery of species on the Critically Endangered Species of Flora List in the state of Rio Grande do Sul. A further five environmental programs are now in operation in the region for recovery of fauna, replanting riparian margins, reforestation, monitoring of the ichthyofauna and the control of invasive species of vegetation.

Wind farms

The Rational Brush Clearance Plan for the installation of the Santa Mônica Wind Farm Complex, begun in 2014, sets out procedures for reducing the impact on the local flora and fauna. While the Company was authorized to clear brush over a 175.1-hectare area, in practice only 28% of this area was effectively cleared. Clearance of 5.79 hectares of a Permanent Preservation Area (APP) for the installation of the project required specific licenses and the replacement of forestry cover in an area equivalent to twice the size of the area cleared (11.58 hectares), also located in an APP. The entire brush clearance phase at the Complex was run in tandem with the Fauna Rescue and Monitoring Program. Other key initiatives under the Basic Environmental Plan (PBA) of the Santa Mônica Wind Complex are:

  • Program for Recovery of Degraded Areas and Control of Erosive Processes;

  • Program for Monitoring Water Quality (surface and ground);

  • Program for Monitoring Soil Quality;

  • Noise and Vibration Level Monitoring Program; and

  • Environmental Education Program.

Operating units in protected areas GRI G4-EN11, G4-EN12, G4-EN13, G4-EN14

ENGIE Brasil Energia has operating units located within or adjacent to protected areas and areas of high biodiversity value. The following shows information on the hydroelectric plants making up the generator complex, the regional biodiversity data shown being extracted from studies undertaken at the time of installation and also the result of ongoing environmental monitoring activities.

Itá HPP
Location: Between the municipalities of Itá (SC) and Aratiba (RS).
Reservoir area: 142 km2.
Permanent Preservation Area (APP): 22.56 km2.
Regional biodiversity: 27 species of mammal, 94 species of birds, 31 species of reptiles, 11 species of amphibians, 40 species of fish and 60 species of flora (tree species).
Convervation Units: Parque Estadual Fritz Plaumann (SC), 7.41 km2; Parque Municipal Teixeira Soares (RS), 4.61 km2; Parque Municipal de Preservação Ambiental de Severiano de Almeida (RS), 0.15 km2.
Cana Brava HPP
Location:  Cavalcante (GO).
Reservoir area: 139 km2.
Permanent Preservation Area (APP): 3.2 km2.
Regional biodiversity: 92 species of mammal, 304 species of birds, 98 species of fish, 41 species of amphibians and 77 species of reptiles.
Convervation Units: Avá-Canoeiro indigenous reserve.
Passo Fundo HPP
Location:  Entre Rios do Sul (RS).
Reservoir area: 151 km2.
Permanent Preservation Area (APP): 4.11 km2.
Regional biodiversity: 18 species of mammal, 122 species of birds, 14 species of reptiles, 10 species of amphibians, 44 species of fish and 20 species of flora.
Convervation Units: Parque Estadual Rondinha, 10 km2; and Reserva Municipal da Sagrisa, 4 km2.
Machadinho HPP
Location: Between Piratuba (SC) and Maximiliano de Almeida (RS).
Reservoir area: 79 km2.
Permanent Preservation Area (APP): 44.05 km2.
Regional biodiversity: 52 species of mammal, 192 species of birds, 63 species of fish, at least 2 important species of reptiles and 522 species of flora.
Convervation Units: Parque Florestal Estadual Espigão Alto (RS), 13.33 km2.
Salto Santiago HPP
Location:Between Rio Bonito do Iguaçu and Saudade do Iguaçu (PR).
Reservoir area: 208 km2.
Permanent Preservation Area (APP): at the time the plant was built, mandatory acquisition of areas for the formation of an APP was not required by the legislation.
Regional biodiversity: 14 species of mammal, 302 species of birds, 14 species of amphibians and 39 species of fish.
Ponte de Pedra HPP
Location: Between Itiquira (MT) and Sonora (MS).
Reservoir area: 14.5 km2.
Permanent Preservation Area (APP): 7.8 km2.
Regional biodiversity: 80 species of mammal, 249 species of birds, 58 species of reptiles, 17 species of amphibians and 9 of invertebrates.
Convervation Units: The plant reservoir lies adjacent to the Parque Estadual da Serra de Sonora with an area of approximately 79 km2.
José Gelazio da Rocha SHP
Location: Rondonópolis (MT).
Reservoir area: 0.27 km2.
Permanent Preservation Area (APP): The legislation does not require the installation of an APP along the plant’s reservoir margin.
Regional biodiversity: 80 species of mammal, 249 species of birds, 58 species of reptiles, 17 species of amphibians and 9 invertebrates.
Convervation Units: Parque Estadual Dom Osório Stoffel, 64.22 km2.
Salto Osório HPP
Location: Between São Jorge d’Oeste and Quedas do Iguaçu (PR).
Reservoir area: 55 km2.
Permanent Preservation Area (APP): At the time the plant was built, mandatory acquisition of areas for the formation of an APP was not required by the legislation.
Regional biodiversity: 13 species of mammal, 303 species of birds, 9 species of amphibians and 39 species of fish.
Rondonópolis SHP
Location: Rondonópolis (MT).
Reservoir area: 0.024 km2.
Permanent Preservation Area (APP): Legislation of the day did not require the installation of an APP along the reservoir margins.
Regional biodiversity: 80 species of mammal, 249 species of birds, 58 species of reptiles, 17 species of amphibians and 9 invertebrates.
Convervation Units: Parque Estadual Dom Osório Stoffel, 64.22 km2.
São Salvador HPP
Location: Between São Salvador do Tocantins and Paranã (TO).
Reservoir area: 104 km2.
Permanent Preservation Area (APP): 47.53 km2.
Regional biodiversity: 26 species of mammal, 242 species of birds, 38 species of reptiles, 29 species of amphibians and 209 species of fish.
Convervation Units: Environmental Protection Area of Lago de São Salvador do Tocantins, Paranã and Palmeirópolis, 145.25 km2.
Estreito HPP
Location: Between Estreito (MA), Aguiarnópolis and Palmeiras do Tocantins (TO).
Reservoir area: 555.0 km².
Permanent Preservation Area (APP): 125.0 km².
Regional biodiversity: 2 species of aquatic mammal, 164 species of birds, 21 species of reptiles, 38 species of amphibians and 50 species of fish.
Convervation Units: The reservoir is adjacent to the Monumento Natural das Árvores Fossilizadas Conservation Unit, 356.3 km².
Areia Branca SHP
Location: Caratinga And Ipanema (MG).
Reservoir area: 1.36 km².
Permanent Preservation Area (APP): 112.71 hectares surrounding the plant reservoir.
Regional biodiversity: 17 species of mammal, 191 species of birds, 6 species of reptiles and 20 species of amphibians.
Convervation Units: No such units directly in the affected area.

As a practice, ENGIE Brasil Energia compensates for the installation of its operations by supporting the creation and maintenance of Conservation Units in some regions where it carries on its business. Examples of this practice are Parque Estadual Fritz Plaumann in Concórdia (SC) and Parque Natural Municipal Mata do Rio Uruguai Teixeira Soares in Marcelino Ramos (RS), both located in the Itá Hydroelectric Plant’s sphere of influence.

Yet another practice which collaborates with the conservation of biodiversity, is the Program for Planting and Donating of Seedlings. Among the program’s activities are the cultivation and distribution to communities of flora, native to the region in which plant operations are located. In 2016 alone, the Company planted and donated 340,269 seedlings.

Water

ENGIE Brasil Energia continually monitors indicators associated with the withdrawal of water used in its operations. Including all water sources, total volumes withdrawn were 704,355,905.06 m3 in 2016 - a year-on-year reduction of 16.6%.

Among the main contributory factors were lower thermoelectric generation, thus implying reduced water consumption, as well as the employment of closed circuit systems allowing the reuse and recirculation of rainwater to reduce demand from hydraulic sources.

The quality of the water that the Company discharges into water bodies is also tracked on a continual basis through physical-chemical and biochemical analysis. In 2016, the planned discharge of water totaled 696,869,429.47 m3 relating to release from the thermoelectric power plants as well as water pumped through the cooling systems of the hydroelectric plants. In both cases, water is returned to the water bodies with a quality and at a temperature compatible with the standards required by the legislation. GRI G4-EN22

Total water withdrawal by source GRI G4-EN8

SourcesVolume withdrawn
2016120152
Surface water, including wetland areas, rivers, lakes and oceans 701,083,410.07 m3 840,195,481.25 m3
Ground water 18,972.13 m3 21,006.94 m3
Rainwater collected directly and stored by the organization 1,199,733.33 m3 2,076,400.00 m3
Water provided by public utilities 2,053,789.53 m3 1,992,472.00 m3
Total volume 704,355,905.06 m3 844,285,360.19 m3

1 The information regarding the indicator was collected at the beginning of October, so the values related to October, November and December were estimated based on consumption from September.
2 The figures for 2015 were adjusted in relation to those published in the 2015 Sustainability Report in the light of final confirmation of consumption for the months of November and December 2015, but estimated at the time of the publication of the 2015 Report.

Use of water in thermoelectric plants - 2016 GRI G4-EN8 - Setorial

Processing 5,300,070.85 m3
Cooling503,132,911.92 m3
Consumption7,346,160.96 m3

Total volume and percentage of recycled, reused water and collected from rainwater GRI G4-EN10

201612015
Recycled water24,601,029.72 m3 (3.49%)22,514,316.79m3 (2.66%)
Reused water2,444,243.74 m3 (0.35%)7,646,243.66 m3 (0.90%)
Rainwater1,199,733.33 m3 (0.17%)2,076,400.00 m3 (0.25%)

1 The information regarding the indicator was collected at the beginning of October, so the values related to October, November and December were estimated based on consumption from September.

Engagement GRI - DMA Sectoral -Water

ENGIE Brasil Energia is a member of eight Hydrographic Basin Committees - part of its contribution to the conservation of water resources - and the forum through which it discusses the sustainable use of water by society jointly with other public and private institutions. The Company has a seat on the State Water Resources Councils for the states of Santa Catarina and Paraná with the same objectives.

In the areas of influence of the hydroelectric plants, multiple reservoir usage is also considered under the umbrella of conservation as a whole. This is disciplined by the Environmental Plan for Conservation and Use of the Riparian Margins of Artificial Reservoirs (Pacuera), a legally constituted instrument for minimizing the negative impacts of operations in the regions surrounding the power plants.

On a different front, and jointly with communities adjacent to some plants, ENGIE Brasil Energia runs the Headwaters Conservation Program, designed to maintain the quality and quantity of water in the areas influenced by its operations. The Program also has the dual purpose of raising the local population’s awareness of the importance of the matter. In 2016 alone, 391 springs were either recuperated or protected, adding to the other 967 conserved since the inception of the Program -- the large proportion of these in the regions of the Salto Osório and Salto Santiago hydroelectric plants in the state of Paraná.

Fuels

ENGIE Brasil Energia’s Climate Change Policy incorporates measures for reducing the consumption of fossil fuels, among these the preferential use of flex-fueled vehicles, the contracting of collective transportation services for employees at the majority of plants and the frequent use of conference calls and video conferencing in order to avoid physical travel.

In 2016, energy consumption from non-renewable sources declined 30% compared with 2015 with significant reductions in the use of gas (GLP) and fuel oil as well as coal given lower dispatch from the thermoelectric plants during the year. These reductions are reflected in total energy consumed by the Company over the years: 62,295,876.81 GJ, a volume 25.8% less than reported in 2015. GRI G4-EN6

Energy consumption within the organization GRI G4-EN3

20162015
Non-renewable
sources
Coal48,770,775.91 GJ58,370,842.88 GJ
Diesel Oil174,667.21 GJ112,604.13 GJ
Fuel Oil 63,499.93 GJ 198,905.66 GJ
Gas1,681,787.21 GJ13,643,509.79 GJ
Total 50,690,730.26GJ72,325,862.46 GJ
Renewable sourcesWood biomass1,320,807.43 GJ2,441,765.81 GJ
Sugar-cane biomass9,682,965.21 GJ8,635,209.87 GJ
Total 11,003,772.64GJ11,076,975.68 GJ
Electricity consumption from the grid2 601,373.90 GJ660,145.50 GJ1
Total energy consumption3  62,295,876.81 GJ84,062,983.64 GJ

Standards, methodologies and assumptions adopted: the criteria used in the calculations and measurement of water withdrawal comply with the requirements of ENGIE Brasil Energia. This data is audited annually by a third party.
1. The amount relates to energy consumption at the units (industrial use + administrative buildings).
2. References (electric energy): the Invoicing Metering System (IMS) is responsible for recording data for electric energy generated and consumed by the plants. There are various norms for minimizing equipment faults and avoiding possible fraud. The ONS provides guidance on the technical aspects to which the IMS is subject. On the other hand, the way the data is handled and the terms and rules for delivering the information are established by the Electric Energy Trade Board (CCEE).
3. Total energy consumption = total renewable fuels + total non-renewable fuels + consumption of electricity from the grid.

Energy sales by type GRI G4-EN3

20162015
Electric energy34,789 (3,971 MW médios)36,012 GWh (4,111 MW médios)
Steam16.3 GWh24 GWh

Energy intensity* GRI G4-EN5

20162015
Energy consumption within the Company (GJ)62,295,876.8184,062,983.64
Energy Production (GJ)160,532,337.19176,191,271.92
Energy intensity (Consumption of energy within the organization/Energy production)10.390.48

1 Types of energy included in the intensity ratio: fossil fuels, renewable fuels and energy from the Grid.

Energy efficiency

The Jorge Lacerda Thermoelectric Complex is responsible for about 75% of all fuel consumption in the thermoelectric plants that the Company operates. The Complex is NBR ISO 50.001 certified, a norm, which focuses on the continual improvement of energy performance including aspects relating to the efficient use of energy. Several control measures have been introduced to meet requirements under this standard, these being subject to internal and external auditing to ensure continued certification.

Waste GRI G4-EN23

ENGIE Brasil Energia has as a guiding principle: to ensure the suitable and final disposal of waste at all its units. The Company requires that the companies engaged to collect and dispose waste comply with the prevailing environmental legislation, more especially Law 12.305 of 2010, which regulates the National Solid Waste Policy.

In comparison with 2015, the total volume of Company waste in 2016 reported a decline of 5%, a reflection of reduced energy output from the thermoelectric plants. This in turn was the result of lower ash volumes from the burning of fossil fuels as well as initiatives designed to continually improve this indicator through targets to reduce waste at all plants as well as head office.

Waste disposal - 2016

HAZARDOUS WASTE (t)
Type of Disposal20162015
Reuse50.9266.58
Recycling 114.1842.33
Recovery, including energy recovery 0.000.0063
Incineration (mass burn) 0.0317.04
Landfill 191.79226.42
On-site storage82.4493.38
Co-Processing268.25223.64
Total707.60669.39
NON-HAZARDOUS WASTE (t)
Type of Disposal20162015
Reuse3.222.12
Recycling1,053,046.101,806,806.09
Composting67.7669.05
Recovery of degraded areas 690,187.05563.01
Recovery, including energy recovery 78.78116.83
Landfills 456.191,592.05
Coal mine shafts33,546.9461,187.49
On-site storage21.6825.94
Co-Processing34.6124.4
Highway surfacing0.000.51
Total1,777,742.201,872,402.49

Disposal of ash

The Company sells fly ash from its coal-fired thermoelectric plants for the manufacture of cement as part of its commitment in the corporate Policy on Climate Change. In 2016, 927.8 thousand tons of ash were delivered to cement manufacturers where it is used as an input to substitute limestone, thus contributing to a reduction in emissions of CO2.

A further 110.9 thousand tons of ash originating from the biomass-fired plants were used for agricultural activities. Additionally, bottom ash is employed as foundation material for highway asphaltic paving. This same material is also used to neutralize soil acidity in the recovery of coalmine tailing dumps with high pH levels.

Emissions

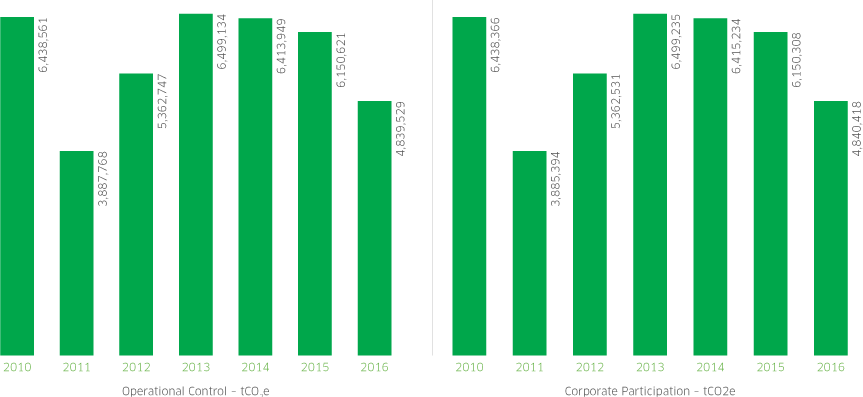
As stated in ENGIE’s Policy on Climate Change, from time to time, the Company prepares a Greenhouse Gas Emissions Inventory (GHG)1, the focus being on the continual improvement in its actions and mitigation and adaptation strategies. Audited by an external independent party, the Inventory is designed to record and quantify emissions based on the concepts and guidelines of the Brazilian GHG Protocol Program. The consolidation of inventory data considers the two approaches used by the Program: operational control and corporate participation2.

The document uses 2010 as its base year, the first year the Company published its GHG Emissions Inventory, gases considered being CO2, CH4, N2O, HFCs PFCs, SF6 and NF3 6.

In the year 2016, the operational control approach registred a reduction of 1,304,409.5 in emissions (scope 1, 2 and 3), exclusivelly due to reduction of coal consuption at thermoelectric plants - less requested to generation in 2016, as a consequence of improvement at hydrologic scenario in the country. G4-EN19

1 ENGIE Brasil Energia’s GHG Emissions Inventory in 2016 was audited by SGS, representing the independent external auditing party.
2 The operational control approach includes 100% of all emissions from the plants and companies over which the Company has operational control, irrespective of corporate stake. Conversely, the corporate participation approach considers emissions from operations of plants according to the Company’s percentage holding in each entity.

Trend in total emissions (em tCO2e)

Below, please find the principal results of the Inventory, available in full from the Company’s website.

Direct emissions

In scope 1, ENGIE Brasil Energia reported total direct emissions of 4,801,366.33 tCO2e using the operational control approach and 4,801,287.37 tCO2e according to the corporate participation method. Compared with 2015, there was an approximate decline of 20%, reflecting lower dispatch from the thermal plants and consequently reducing consumption of coal and natural gas. Worthy of note in this context is that the coal-fired thermoelectric plants account for 97% of all the Company’s direct emissions.

The emissions from biomass (scope 1) were 1,055,548.47 tCO2 for operational control, and 968,328.92 tCO2 for corporate participation. G4-EN15

Direct emissions - Scope 1 (in tCO2e) G4-EN15

201420152016
Operational controlCorporate participationOperational controlCorporate participationOperational controlCorporate participation
Stationary combustion6,358,562.586,357,397.516,093,182.656,091,658.384,796,867.414,795,133.36
Mobile combustion671.54693.97637.11658.51536.97555.09
Processes4,120.114,120.115,345.055,345.053,360.393,360.39
Fugitive emissions26.141,170.04226.73236.13574.152,207.65
Agricultural activities4.6311.215.738.323.6625.81
Solid waste0.370.3712.612.893.765.05
Total Scope 16,363,385.376,363,393.226,099,409.886,097,919.264,801,366.344,801,287.35

Scope 1 - Variation (%)

Operational ControlCorporate participation
2014-1.38%-1.35%
2015-4.15%-4.17%
2016-21.28%-21.26%

Indirect emissions

Acquisition and consumption of energy

ENGIE’s total scope 2 emissions in 2016 were 10,231.74 tCO2e using the operational control method and 10,938.15 tCO2e according to the corporate participation approach. In volume terms, these totals represented a year-on-year decline of approximately 45%. The variation is principally due to lower energy consumed from the grid together with a decline in the average emissions factor of the National Interconnected System (SIN) - a 34.4% decrease over 2015, due to an improvement in the hydrological situation nationwide and as a result, lesser demand for generation at the thermal plants. G4 EN-16

Indirect emissions -Scope 2 (in tCO2e) G4 EN-16

201420152016
Operational controlCorporate participationOperational controlCorporate participationOperational controlCorporate participation
Energy18,711.2519,670.3118,751.3219,709.0010,231.7410,938.15

Scope 2 - Variation (%)

Operational controlCorporate participation
2014-0.72%-2.47%
20150.21%0.20%
2016-45.43%-44.50%

Other sources

In relation to scope 3 -- covering indirect emissions due to transportation of raw materials, employee commuting, business travel and waste generated in the operations - the Company recorded 27,930.83 tCO2e using the operational control approach and 28,192.34 tCO2e for the corporate participation method. Compared to the result for 2015, scope 3 emissions fell by approximately 14% in 2016. Lower consumption of diesel oil in transportation activities is among the factors contributing to this reduction.

The emissions from biomass (scope 3) were 2,333.79 tCO2 for operational control, and 2,224.85 tCO2 for corporate participation. G4-EN17

Indirect emissions - Scope 3 (in tCO2e) G4-EN 17

201420152016
Operational controlCorporate participationOperational controlCorporate participationOperational controlCorporate participation
Activities related to fuel and energy not included in scopes 1 and 21,642.861,642.8639.9739.972.572.57
Transportation and distribution (upstream)18,679.8618,800.6119,824.8419,929.9317,360.3617,458.07
Waste generated in the operations502.26503.31807.45816.05531.11543.27
Business travel662.6718.35915.34981.16944.051,030.41
Employee commuting (residence - work)345.1484.87458.34498.53304.73370.00
Transportation and distribution (downstream)10,020.2010,020.2010,414.2610,414.268,788.028,788.02
Total - Scope 331,852.8732,170.2032,460.2132,679.9027,930.8428,192.34

Scope 3 - Variation (%)

Operational controlCorporate participation
201413.77%13.59%
20151.91%1.58%
2016-13.95%-13.73%

Complementary indicators

EMISSIONS INTENSITY (tCO2/MWh)7 G4-EN18
Operational controlVariation (%)Corporate participationVariation (%)
20140.2308-2.0%20140.1715
20150.2115-8.3%20150.1592-7.2%
20160.1917-9.4%20160.1436-9.8%

The emissions intensity calculation is based on the net energy and considers emissions from Scopes 1, 2 and 3.

EMISSIONS OF OZONE DEPLETING SUBSTANCES (ODS) G4-EN20
ODSOperational controlCorporate participationOperational controlCorporate participationOperational controlCorporate participation
20152016Variation 2015/2016
HCFC (R-22)374.67438.35426.20438.1813.75%-0.04%
NOx, SOx emissions and other significant air emissions in t/MWh G4-EN21
2013201420152016Variation
NOx0.000380.000360.00033110.000307082-7.3%
SOx0.002780.002420.00251650.002319571-7.8%
Particulate matter (PM)0.000060.000080.00007560.0000659-12.8%
Volume of NOx, Sox emissions and Particulate Matter G4-EN21
20152016Variation
NOx21,951.5513,364.40-39.1%
SOx119,853.50100,949.04-15.8%
Particulate matter (PM)3,643.132,867.33-21.3%
Emissions by net generation (total) and combustion units G4-EN21
EmissionsNet generation (t/MWh)Combustion plants (t/MWh)
NOX13,364.400.000310.00290
SOX100,949.040.002320.02187
Particulate matter (PM)2,867.330.000070.00062

1 Investments made between January and October 2015 except research and development values and environmental education programs where the figures are for the January-December 2016 period.
2 Item classified as Operating Expenditures (Opex), the remaining amount in the category being R$ 18,917,727.41

Investments

In 2016, ENGIE Brasil Energia allocated approximately R$ 14.8 million to investment initiatives of an environmental nature. The following table shows the principal investments in the area during the year.

Total environmental protection expenditures and investments by type GRI G4-EN31 1

CategoryAllocationAmount (R$)
Prevention and environmental management costsEnvironmental Education Programs21,853,547.34
Research and Development9,959,136.38
Extra expenditures with the installation of cleaner technologies2,710,708.20
Kitchen to Horta Modelo area - Environmental Education56,347.01
Waste disposal, emissions treatment and remediation costsTreatment of emissions127,618.14
Expenditures on equipment, maintenance and operating materials and services and related personnel costs97,293.30
Total:14,804,677.37

1 Investments made between January and October 2016, except research and development values and environmental education programs, which consider the period from January to December 2016.
2 Item classified as Operating Costs (Opex), so that the remaining value of the category was R$ 18,917,727.41.