PT | EN

Macroeconomic scenario

Throughout 2016, the Brazilian economy continued the recessionary trajectory of the preceding year. Gross Domestic Product reported a retraction of 3.6%1 or 9% when compounded with the decline since the outset of the economic recession in 2014. This was the first time that Brazil has recorded two consecutive years of economic downturn since the inception of the official series in 1948. In 2015, GDP fell by 3.8%, the greatest decline in 25 years.

IBGE data shows that the country ended the year reporting official inflation at 6.3%1 – at the ceiling of the government’s inflation band and driven largely by food prices. The accumulated primary deficit for the public sector was R$ 154.3 billion – representing 2.4% of GDP, the worst result for the historic series2. The commercial US Dollar closed 2016 reporting a 17.7% devaluation against the Real at R$ 3.2497, the first annual decline in the US currency since 2010.

Industrial production posted a decrease of 6.6% in relation to 2015. The labor market was also affected: at the end of the year, jobless numbers in Brazil stood at 12.3 million – the average unemployed rate for 2016 as a whole was 11.5% and above the result of 8.5% for 2015.1

A study on competitiveness by the National Confederation for Industry (CNI) classified Brazil in 17th place in a ranking of 18 countries. The CNI found that due to the economic recession, the country lost ground in four of the nine items evaluated: availability and cost of labor, the macro-economic environment, competition and scale of the domestic market and technology and innovation. On the other hand, there was an improvement in the item for education.

1. Source: IBGE – Instituto Brasileiro de Geografia e Estatística.
2. Source: Banco Central do Brasil.


Compared with 2015, energy consumption reported 6.8% growth in the free consumer market and fell 3.5% in captive market.

Electric sector context

An economy in recession reflected directly in demand for electric energy in Brazil. According to Energy Research Company (EPE) data, electricity consumption amounted to 460,001 GWh in 2016, a decrease of 0.9% compared with 2015. The residential segment represented 132,893 GWh of this total and 1.4% year-on-year higher, the only segment to record an increase in consumption in the period. However, average residential consumption ended the year practically unchanged – 160 kWh/month relative to 161 kWh/month reported for 2015. Annual consumption for the commercial and industrial segments was 88,185 GWh (-2.5%) and 164,034 GWh (-2.9%), respectively.

Most notable in terms of consumption by region were decreases in the Southeast (-1.8%) and in the Center-West (-1.0%) of the country. The Northeast and South regions turned in almost stable results in relation to 2015, albeit both with a slight decline of 0.3%. The North region was the only one to register growth - 2.0%.

Consumption also reported growth in the free consumer market at 123.3 TWh – an increase of 6.8% compared with 2015. Meanwhile, consumption in the captive market fell 3.5% in the period.

The scenario in 2016 was an even more critical one than 2015 in relation to hydrology and corresponding hydroelectric plant inflows. Both the North and Northeast regions experienced their second worst year ever. Conversely, strong inflows in the Southeast and the Center-West region in January 2016 combined with regular inflows in the South for the best part of the year together with a significant decrease in energy consumption, resulted in the Price for the Settlement of Differences (PLD) remaining relatively low for the period.

Authorization was given to increase reservoir storage at the hydroelectric plants in relation to 2015. Although this in practice meant just a modest rise in water levels, the consequence was that plant efficiency rose with more energy being produced with less water. This increase was more intense in early 2016 due to stronger inflows reported for the Southeast and Center-West, permitting reduced dispatch from the hydro plants in the North and the Northeast. It was in this period that PLD values fell to their lowest point. The impact of restrictions on energy transmission combined with the reduced supply of hydroelectricity in the North and the Northeast meant that the PLD for these regions exceeded that for the remaining regions on several occasions.

Electric Energy Trade Board data reveals that the Generation Scale Factor - representing the percentage of physical guarantee generated by the hydroelectric plants - was 87.1% in 2016, higher than the 84.3% reported in 2015.

ENGIE Brasil Energia’s economic financial performance

Net revenue from sales

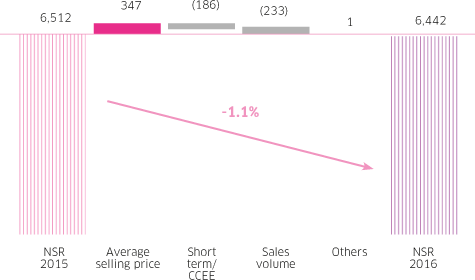
When comparing full years, net revenue from sales declined from R$ 6,512.0 million in 2015 to R$ 6,442.4 million in 2016, representing a reduction of R$ 69.6 million or 1.1%. This decline is essentially a reflection of the following combination of events: (i) +R$ 347.0 million due to the increase in average net selling price; (ii) -R$ 232.5 million due to lower volumes of energy sold; and (iii) -R$ 185.5 million, a reflection of the reduction in revenue from transactions conducted across the short-term market, more particularly those executed within the scope of the CCEE.

Trend in net sales revenue - NSR
(R$ million)

Ebitda and Ebitda Margin

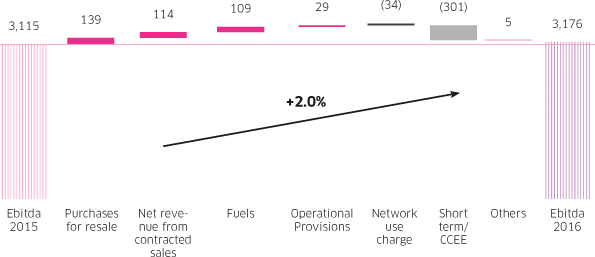
Ebitda posted an increase of R$ 61.0 million (or 2.0%) from R$ 3,114.6 million in 2015 to R$ 3,175.6 million in 2016. The Ebitda margin in 2016 was 49.3%, representing an increase of 1.5 p.p. in relation to 2015. These increases reflect principally a combination of factors: (i) the negative R$ 301.0 million in transactions executed in the short-term market – more specifically, those executed within the scope of the CCEE; (ii) a reduction of R$ 139.2 million in energy purchases for resale; (iii) a growth of R$ 114.5 million in net revenue from the sale of contracted energy; (iv) a decrease of R$ 109.0 million in fuel consumption; (v) an increase of R$ 34.3 million in charges for the use of the electricity network and connections; (vi) the positive effect of R$ 28.7 million in net operating provisions; and (vii) the decrease of R$ 4.9 million in other costs and operating expenses.

Trend in Ebitda* (R$ million)

* EBITDA represents: net income + income tax and social contribution + net financial expenses + depreciation and amortization.


Net Income

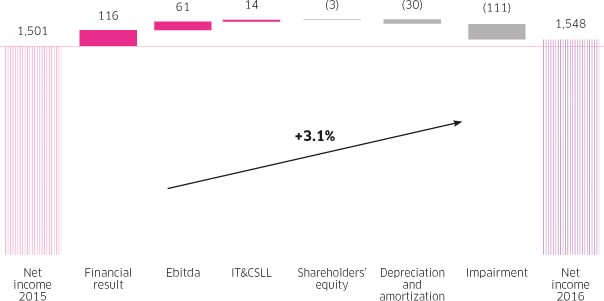
In 2016, net income increased from R$ 1,501.3 million in 2015 to R$ 1,548.3 million, an increase of R$ 47.0 million or 3.1%. This variation is due to the following factors: (i) growth of R$ 61.0 million in Ebitda; (ii) an increase of R$ 29.8 million in depreciation and amortization; (iii) growth in asset impairment of R$ 110.6 million; (iv) a reduction of R$ 115.7 million net financial expenses; (v) a decrease of R$ 13.5 million in Income Tax and Social Contribution; and (vi) a negative amount for the equity item of R$ 2.8 million.

Trend in net income (R$ million)

Value Added

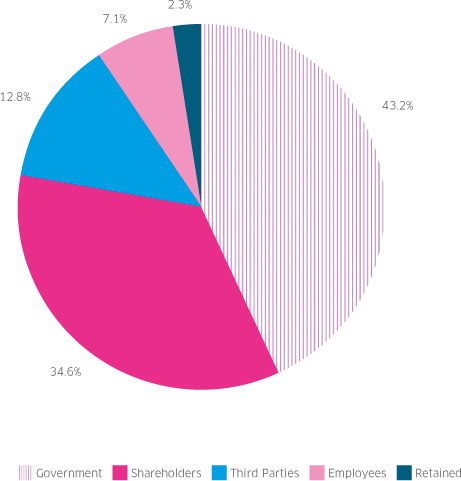
Total Value Added (VAT) in 2016 was R$ 4,199.7 million, a year-on-year increase of R$ 78.4 million (or 1.9%). This amount, which represents value created by the Company on the basis of a global vision of performance, was distributed among the stakeholders as shown in the following chart.

Distribution of Value Added (DVA) in 2016 (%)

Detailed information on the composition of each of the Company’s results and in relation to the context in which they were obtained can be found in the Management Report 2016.

The table below summarizes ENGIE Brasil Energia’s principal economic-financial results for 2016 compared to those reported in preceding years.

Summary - Economic-Financial Performance GRI G4-EC1

201420152016Variation 2016/2015
Financial Information (R$ million)
Total assets13,609.615,289.414,419.7-5.7%
Shareholders' equity5,654.96,642.16,614.4-0.4%
Net revenue from sales6,472.56,512.06,442.4-1.1%
Gross income2,497.72,708.92,740.91.2%
Income before financial result/taxes (EBIT)12,302.92,503.82,421.6-3.3%
Income before taxes1,956.62,033.22,066.71.6%
Net income1,383.11,501.31,548.33.1%
EBITDA22,895.13,114.63,175.62.0%
Financial Indicators (R$ million)
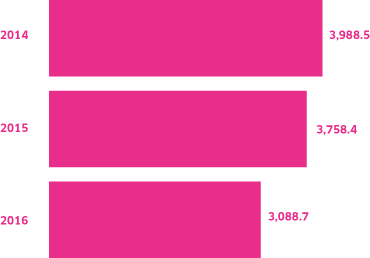
Total debt (loans, financing and debentures)3,988.53,758.43,088.7-17.8%
Cash and cash equivalents and restricted deposits1,750.72,543.61,995.5-21.5%
Net debt2,237.81,214.81,093.2-10.0%
ROCE3 (%)                 22.3                 23.1                 21.9-1.2 p.p.
Gross Debt/EBITDA1.41.21.0-0.2 p.p.
Net debt/EBITDA0.80.40.3-0.1 p.p.
Participation of third party capital in relation to total assets (%)                 58.4                 56.6                 54.1-2.5 p.p.
Operational margin (%)                 30.2                 31.2                 32.10.9 p.p.
Net margin (%)                 21.4                 23.1                 24.00.9 p.p.
Shares
Net earnings per share (R$)2.11892.30002.37203.1%
Average price per share4 – ON (R$)30.3031.7235.9913.5%
Dividends per share (R$)1.18761.27892.278678.2%
Employees' salaries and benefits               263.7               292.3               297.51.8%
Payments to government            1,681.3            1,858.7            1,814.5-2.4%

(1) EBIT = operating income + financial result;
(2) EBITDA = net income + income tax and social contribution + net financial expenses + depreciation and amortization + provision for impairments;
(3) ROCE (return on employed capital) = results from the service/non-current assets; and
(4) Simple average of daily average prices adjusted for dividends.

Debt

The Company’s total gross consolidated debt as at December 31, 2016, represented mainly by loans, financing and debentures, net of hedge operations, totaled R$ 3,088.7 million, a decrease of 17.8% (R$ 669.7 million) compared to the position as at December 31, 2015.

Out of total debt at year-end 2016, there was no foreign currency denominated debt outstanding compared with 2015, when debt denominated in foreign currency was 34.2% of the total. Currency loans and their respective hedges were settled in December 2016 on due date.

The average weighted nominal cost of debt in the end of 2016 was 10.5%.

On December 31, 2016, the Company’s net debt (total debt less derivative operations, deposits earmarked to the guarantee of debt servicing and cash and cash equivalents) was R$ 1,093.2 million, a reduction of 10.0% compared with the end of 2015.

The Company’s total gross consolidated debt as at December 31, 2016 was 17.8% inferior compared to the position as at December 31, 2015.

Total debt (R$ million)

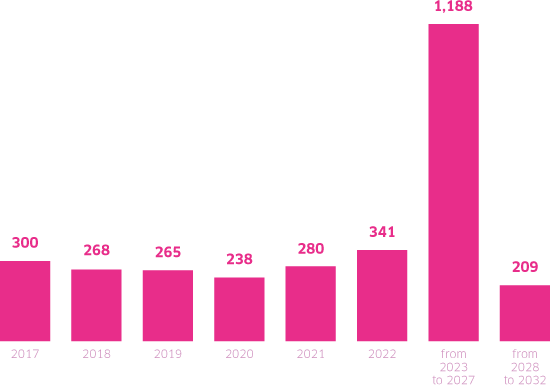
Loan maturity profile (R$ million)

Net debt (R$ million)

12.31.201412.31.201512.31.2016Var. % 2016/2015
Gross debt4,052.74,247.23,088.7-27.3
Result of derivatives operations(64.2)(488.8)0.0-100.0
Deposits earmarked for the payment of debt(146.0)(146.8)(180.2)22.8
Cash and cash equivalents(1,604.7)(2,396.9)(1,815.3)-24.3
Total net debt2,237.81,214.81,093.2-10.0

Capital expenditures

In 2016, the Company invested a total of R$ 1,189.7 million in construction, maintenance and revitalization of its generator complex and in the acquisition of projects. Construction work at the Santa Mônica and Campo Largo Wind Parks, the Pampa Sul TPP and the Central Fotovoltaica Assú involved further investments of R$ 875.1 million. An additional R$ 191.6 million was dedicated to investments in maintenance projects with a view to the continuation of a high plant uptime fator, this being 97.2% in 2016 as mentioned in the “Uptime” item. A total of R$ 97.8 million was invested in the modernization of Salto Santiago and Passo Fundo plants. During the year, the Company also acquired projects totaling R$ 25.2 million.

Proposed complementary dividends

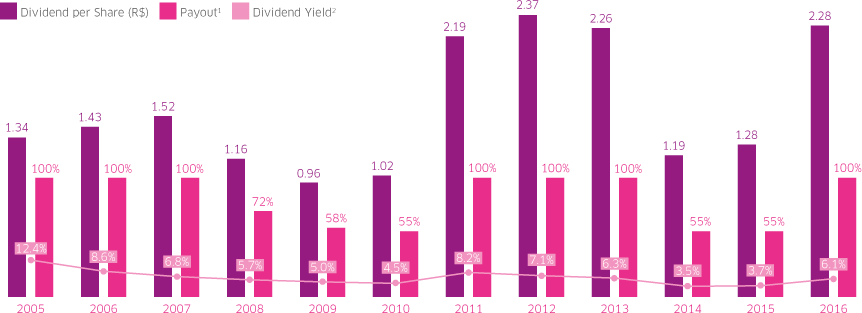
The Board of Directors’ total proposed payout for fiscal year 2016, including interest on shareholders’ equity and ratified by the Annual General Meeting, amounted to R$ 1,487.3 million, equivalent to R$ 2.278604 per share or 100% of the adjusted distributable net income.

Track record of dividend distribution (payout)

1 Considering adjusted net income for the fiscal year.
2 Based on the closing price weighted for the volume of common shares in the period.

Capital markets

Since July 21, 2016 and in the light of the new corporate denomination, the Company’s shares have been traded on the BM&FBOVESPA under the new stock exchange name of ENGIE BRASIL and EGIE3 replacing the former TBLE3 symbol. In addition to its presence in the Brazilian capital markets, Company’s Level 1 American Depositary Receipts (ADRs) are traded on the United States over-the-counter market (OTC) under the EGIEY symbol at the ratio of one ADR to each common share.

The listing on the Novo Mercado – BM&FBovespa’s highest level of corporate governance – enhances shareholders’ rights and provides guarantees as to the quality of disclosed information in relation to the businesses. The following are the stock indices of which ENGIE Brasil Energia is a component:

  • Bovespa Stock Index (Ibovespa)

  • Differentiated Corporate Governance Stock Index (IGC)

  • Differentiated Tag Along Stock Index (ITAG)

  • Corporate Sustainability Stock Index (ISE)

  • Electric Energy Stock Index (IEEX)

  • Vigeo Eiris EM 70

Share performance

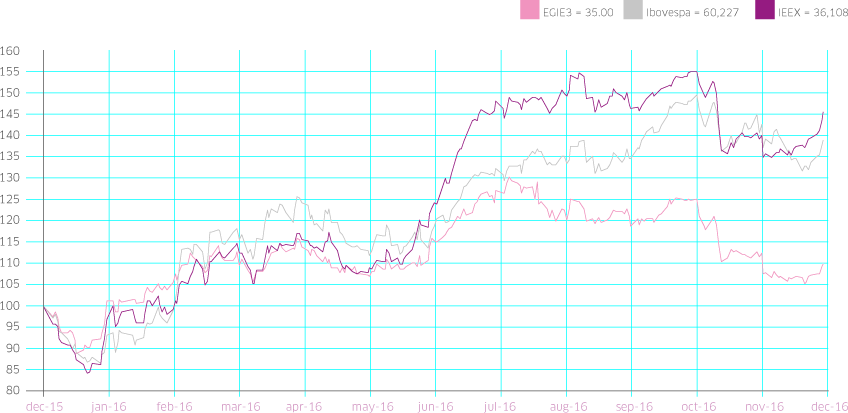
After three consecutive years of decline, the Ibovespa, Brazil’s benchmark stock index, reported a year-on-year appreciation of 38.9% in 2016 in spite of sharp volatility and set against the background of a tumultuous political scenario. The variation reflected essentially investor optimism in the light of the impeachment proceedings against the ex-president and the market outlook for greater political and fiscal stability. Abroad, the year was marked by the unexpected outcome to the Brexit referendum, losses in Deutsche Bank’s market value, political uncertainty in countries such as France and Italy and by the election of Donald Trump in the United States.

In this scenario, ENGIE Brasil Energia’s shares closed 2016 with an appreciation of 9.9% compared with 2015, less than the performance recorded for the Ibovespa and the Electric Energy Stock Index (IEEX), which reported increases in valuation of 38.9% and 45.6%, respectively. EGIE3’s closing price for 2016 was R$ 35.0, equivalent to a market valuation of R$ 22.8 billion. For 2016 as a whole, the average daily trading volume was R$ 33.5 million, an increase of 20.2% in relation to 2015.

EGIE vs. Ibovespa vs. IEEX (Baseline 100 – 12.31.2015)

Ratings

The Company’s risk classification rating suffered a downgrade in 2016 to ‘brAA-‘ due to the downgrading of Brazil’s sovereign rating. Fitch Ratings downgraded the Company’s international foreign currency rating from BBB- to BB+ with a negative outlook.

ENGIE Brasil Energia’s Long-Term National rating remained at ‘AAA (bra)’, with a stable outlook.