Integration Links
The employees that work at the administrative unit of inpEV, in São Paulo, at container receiving centers in Rondonópolis (MT) and Taubaté (SP) and the regional operation coordinators (CROs) are the internal public of the institute. They have encouraged the integration of the Campo Limpo System chain links through actions and coordination of container receiving units (stations or centers), with the collaboration of distributors and cooperatives.
At the end of 2012, inpEV had 47 direct employees and four outsourced professionals, one trainee and one underage apprentice, 58% male and 42% female employees. The institute’s staff have most employees working as coordinators (32%) and more than half (62%) in the Southeast Region. All of them are on non-fixed term employment contract and work full time, except for trainees and underage apprentices, who work six hours a day. <LA1>
Number of direct and indirect employees, by function level <LA1>
| Category | 2010 | 2011 | 2012 | |||
|---|---|---|---|---|---|---|
| Male | Female | Male | Female | Male | Female | |
| Board of Directors | 1 | 0 | 1 | 0 | 1 | 0 |
| Management | 2 | 3 | 2 | 3 | 3 | 2 |
| Leaders/Coordinators | 9 | 5 | 11 | 6 | 11 | 6 |
| Technical/Supervision | 0 | 2 | 0 | 3 | 0 | 3 |
| Administration | 4 | 7 | 4 | 8 | 4 | 8 |
| Operations | 9 | 0 | 9 | 0 | 9 | 0 |
| Third Parties | 1 | 3 | 1 | 3 | 1 | 3 |
| Underage Apprentices | 0 | 0 | 1 | 0 | 1 | 0 |
| Trainees | 0 | 2 | 0 | 1 | 1 | 0 |
| Total by gender | 26 | 22 | 29 | 24 | 31 | 22 |
| Total | 48 | 53 | 53 | |||
Number of direct and indirect employees, by type of employment contract <LA1>
| Type of employment contract | 2010¹ | 2011¹ | 2012 | |
|---|---|---|---|---|
| Male/Female | Male/Female | Male | Female | |
| Fixed term employment contract | 1 | 0 | 2 | 0 |
| Non fixed term employment contract | 47 | 53 | 29 | 22 |
| Total by gender | ND | ND | 31 | 22 |
| Total | 48 | 53 | 53 | |
¹ For 2010 and 2011, there is no definition of number of employees by gender and type of employment contract. With improvements in the management system, such data were available in 2012.
ND – not defined.
Number of direct and indirect employees, by region <LA1>
| Region | 2010¹ | 2011¹ | 2012 | |
|---|---|---|---|---|
| Male/Female | Male/Female | Male | Female | |
| South Region | 2 | 2 | 2 | 0 |
| Southeast Region | 32 | 36 | 16 | 17 |
| Central West Region | 13 | 13 | 11 | 3 |
| Northeast Region | 1 | 2 | 2 | 1 |
| North Region | 0 | 0 | 0 | 1 |
| Total by gender | ND | ND | 31 | 22 |
| Total | 48 | 53 | 53 | |
¹ For 2010 and 2011, there is no definition of number of employees by gender in the regions where inpEV operates. With improvements in the management system, such data were available in 2012.
ND – not defined.
Number of direct and indirect employees, by working hours <LA1>
| Working hours | 2010¹ | 2011¹ | 2012 | |
|---|---|---|---|---|
| Male/Female | Male/Female | Male | Female | |
| Full time | 48 | 52 | 29 | 22 |
| Part time | 0 | 1 | 2 | 0 |
| Total by gender | ND | ND | 31 | 22 |
| Total | 48 | 53 | 53 | |
¹ For 2010 and 2011, there is no definition of number of employees by gender and working hours. With improvements in the management system, such data were available in 2012.
ND – not defined.
In the 2012 balance (January to December), inpEV hired 19 and dismissed 19 employees, keeping the same number of employees since 2011. The hiring rate was 29% for male employees and 10% for female employees, while the dismissal rates were 24% and 14%, respectively, which increased the number of male employees. Most staff hiring and dismissals were in the Southeast Region, and involving employees between 36 and 45 years old. <LA2>
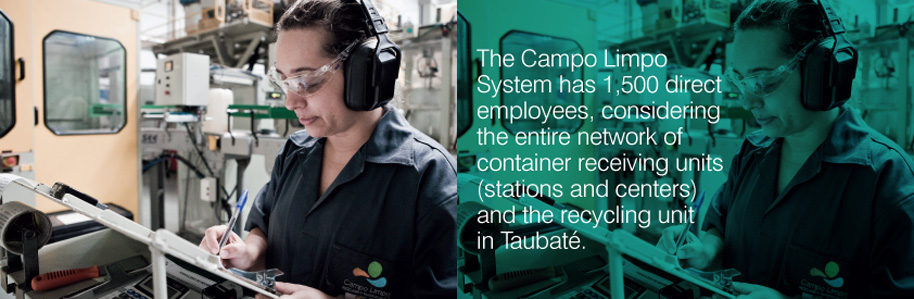
At the container receiving units of Rondonópolis (MT) and Taubaté (SP), 11 and 6 new jobs were created, respectively, in 2012. Considering the recycling unit, also in Taubaté, and the entire network of stations and centers across the country, there are 1,500 jobs directly related to Campo LImpo System today. <EC9>
Total employees dismissed, retired or who died <LA2>
| 2010 | 2011 | 2012 | ||||
|---|---|---|---|---|---|---|
| Male | Female | Male | Female | Male | Female | |
| Total by gender | 11 25% | 4 9% | 10 20% | 3 6% | 12 24% | 7 14% |
| Total | 15 34% | 13 26% | 19 38% | |||
Total number and rate of staff hiring <LA2>
| 2010 | 2011 | 2012 | ||||
|---|---|---|---|---|---|---|
| Male | Female | Male | Female | Male | Female | |
| Total by gender | 13 30% | 4 9% | 13 27% | 4 8% | 14 29% | 5 10% |
| Total | 17 39% | 17 35% | 19 39% | |||
Total number and rate of staff dismissals, by age group <LA2>
| Age Group | 2010¹ | 2011¹ | 2012 | |
|---|---|---|---|---|
| Male/Female | Male/Female | Male | Female | |
| 18-35 years old | 0 | 0 | 5 10% | 2 4% |
| 36-45 years old | 8 18% | 9 18% | 6 12% | 4 8% |
| 46-60 years old | 7 16% | 4 8% | 1 2% | 1 2% |
| 60 years old or more | 0 | 0 | 0 | 0 |
¹ For 2010 and 2011, there is no definition of total number of employees by gender and rate of dismissals by age group. With improvements in the management system, such data were available in 2012.
Total number and rate of staff hiring, by age group <LA2>
| Age Group | 2010¹ | 2011¹ | 2012 | |
|---|---|---|---|---|
| Male/Female | Male/Female | Male | Female | |
| 18-35 years old | 0 | 1 2% | 1 2% | 2 4% |
| 36-45 years old | 5 11% | 15 31% | 9 18% | 2 4% |
| 46-60 years old | 11 25% | 1 2% | 4 8% | 1 2% |
| 60 years old or more | 1 2% | 0 | 0 | 0 |
¹ For 2010 and 2011, there is no definition of total number of employees by gender and rate of staff hiring by age group. With improvements in the management system, such data were available in 2012.
Total number and rate of dismissal, by region <LA2>
| Region | 2010¹ | 2011¹ | 2012 | |
|---|---|---|---|---|
| Male/Female | Male/Female | Male | Female | |
| South Region | 0 | 0 | 0 | 0 |
| Southeast Region | 7 16% | 4 8% | 5 10% | 6 12% |
| Central West Region | 8 18% | 9 18% | 7 14% | 1 2% |
| Northeast Region | 0 | 0 | 0 | 0 |
| North Region | 0 | 0 | 0 | 0 |
¹ For 2010 and 2011, there is no definition of total number of employees by gender and rate of dismissals by region. With improvements in the management system, such data were available in 2012.
Total number and rate of staff hiring, by region <LA2>
| Region | 2010¹ | 2011¹ | 2012 | |
|---|---|---|---|---|
| Male/Female | Male/Female | Male | Female | |
| South Region | 0 | 0 | 0 | 0 |
| Southeast Region | 8 18% | 8 16% | 7 14% | 5 10% |
| Central West Region | 9 21% | 9 18% | 6 12% | 0 |
| Northeast Region | 0 | 0 | 1 2% | 0 |
| North Region | 0 | 0 | 0 | 0 |
¹ For 2010 and 2011, there is no definition of total number of employees by gender and rate of staff hiring by region. With improvements in the management system, such data were available in 2012.
Remuneration
In its remuneration policy, inpEV uses the minimum wage (R$ 622, on December 31, 2012) as a reference. In regions with more relevant operations – at the headquarter in São Paulo and the two container receiving centers, in Taubaté (SP) and Rondonópolis (MT) –, only one employee (underage apprentice) receives the national basic value. The other employees receive salaries above this value. <EC5>
Variation of salary variation1, by gender <EC5>
| 2010² | 2011 | 2012 | ||||
|---|---|---|---|---|---|---|
| Female | Male | Female | Male | Female | Male | |
| São Paulo | 134% | 338% | 118% | 586% | 146% | 539% |
| Rondonópolis | 113% | 143% | 159% | 163% | 170% | 157% |
| Taubaté | 257% | – | 400% | 100% | 146% | 193% |
¹ Variation of the proportion of the lowest salary compared to local minimum wage.
² Alteration of 2010/2011data, due to corrections in prior calculations.
Private pension plan
inpEV offers a private pension plan (of voluntary adhesion) to the employees who work in its units in Taubaté, Rondonópolis and at its headquarter in São Paulo and to regional operation coordinators in ten other cities in Brazil (except for operators at container receiving centers, trainees and underage apprentices).
This benefit if offered in the categories of VGBL - Vida Gerador de Benefício Livre (Life Free Benefit Generator) and PGBL - Plano Gerador de Benefício Livre (Plan Free Benefit Generator). The beneficiaries can contribute with 3% or 6% of the gross salary – and the institute contributes with the same rate as that chosen by the employee. In 2012, the resources totaled R$ 209,291.34, representing the monthly average of R$ 17,440.95. In this period, 31 employees were participating in the private pension plan. <EC3>
Ethical Conduct
>inpEV does not offer a formal and structured anticorruption training program, but, according to its Code of Conduct, handed to all employees in the beginning of the employment relationship and signed by them, the institute makes all efforts to practice the highest standard of ethical conduct, without allowing or contributing to acts and procedures that seek to violate restrictions imposed by laws, regulations and standards.
Thus, it seeks to avoid conflicts of interest of its employees, associated companies, associations, partners and suppliers. For cases of relationship with representatives from public bodies (the Legislative, the Executive and the Judicial government branches and the Public Ministry), support is offered in situations that may represent this type of conflict, assisting them in their attitudes to solve such situations. Also, no concession of advantages or privileges is allowed to public agents due to the function they have. Guidance is provided requesting ethics in themes involving activities of the institute and the government, at all levels of public administration.
In 2012, there were no cases of noncompliance with regulations and voluntary codes of marketing communication, advertising, promotion or sponsorship, and no fines for failure to observe laws and regulations related to the supply and use of products and services.
In its 11-year history, inpEV has never reported any internal or external case of discrimination due to ethnic, color, gender, religion, ideology, nationality or social origin reasons, and no slaver labor, child labor or young people exposed to dangerous labor. All employees are hired under the CLT (Labor Laws of Brazil), and the jobs at the other container receiving units are formal, using the same contract basis.

Performance Assessment <LA12>
All employees of inpEV always receive professional performance assessment. In addition, all administrative employees, that is, except for the operators of container receiving centers, have employment contracts based on goals.
The result agreements are established between the leader and his/her subordinate, and starting in 2013, they will be revised three times a year to monitor the performance and monitoring of goals and results, enabling alterations or adaptations, as required.