Economic and Financial Analysis
Results
Like in recent years and even faced with the atypical state of affairs in 2013, we had a positive performance and our results were above the Brazilian retirement market average.
Leader in Net Deposits (Quantum Axis – December 2013)
As the leading trustee in net deposits (total deposits plus any rollovers receivable less withdrawals and rollovers payable) since 2008, we had BRL 13.8 billion in net deposits in 2013. This result is 5% higher than 2012, while the market recorded -29%. By retaining the market leadership in net deposits, we ended FY 2013 with a 54.8% market share.
Assets Under Management (FenaPrevi – December 2013)
We ended FY 2013 with BRL 84.5 in assets under management, a 29% gain over 2012 and higher than the market average, which experienced a 12.8% increase. With this result, we had a 22.6% market share in assets under management.
Leader in Deposits (FenaPrevi – December 2013)
In 2013, we became the leading trustee in total deposits, with BRL 23.2 billion, a 27.2% increase over 2012, which is higher than the market average (4.6%). We had a 31.5% market share in deposits during this period.
Our PGBL and VGBL products ended FY 2013 with BRL 22.6 billion, a 27.9% increase over the previous year. We also grew more than the market (4.4%). As a result, we took the lead in revenue for these products, with a 32.4% market share.
Leader in Deposits by Segment (FenaPrevi – December 2013)
For individuals, our deposits added up to BRL 20.9 billion, a 27.7% increase over 2012. These gains were higher than the market average (2%). For children and teenagers, we took in BRL 816.1 million and experienced a -4.8% drop, which is still better than the market average (-22.7%). For businesses, we took in 1.4 billion, a 48.2% gain over the previous fiscal year and higher than the market average (34.3%).
Leader in Rollovers (FenaPrevi – November 2013)
We ended the fiscal year with a positive net rollover balance, with BRL 899 million in rollovers receivable against BRL 785 million in rollovers payable. In our year-to-date figures, we reached BRL 141 million.
* December data not disclosed until the closing of this publication.
Technical Reserves (FenaPrevi – December 2013)
In 2013, we had a balance of BRL 83.5 billion in technical reserves, a 24.1% increase over the previous year. This figure is higher than the market average, with 15%.
Net Income (Brasilprev Data – 2013 Annual Balance)
At the end of 2013, we posted a net profit of BRL 582.5 million, an unprecedented result that represents a 20.4% increase over the BRL 484 million we gained in 2012.
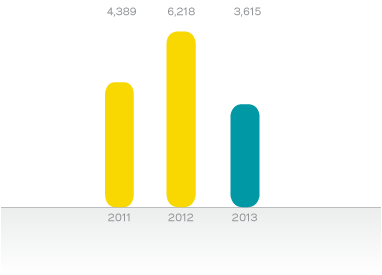
Statement of Value Added (SVA)
The value we add is a testament to our ability to generate wealth and shows how these funds are distributed among our various stakeholders. The value added is calculated based on the difference between earnings from the sale of products and services and expenses stemming from the purchase of goods and services from third parties as well as depreciation and amortization costs.
Policies on reinvesting earnings and paying out dividends are established in our corporate bylaws and discussed during meetings of shareholders. Minimum mandatory dividends are paid out to shareholders at a minimum rate of 25% of the fiscal year's net income.
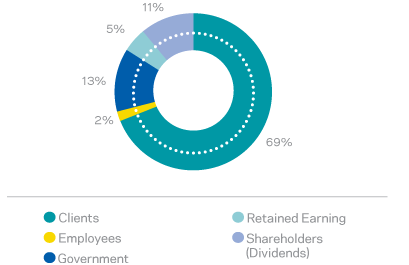
Based on the FY 2013 results, our value added worked out at BRL 3,615 million, 41.9% lower than the previous year because of the fluctuations in the financial markets during the fiscal year. The payout volume was thus: 69% for clients (fund compensation), 13% for the government (taxes), 11% for shareholders (dividends), 5% in retained earnings, and 2% for employees (please refer to Statement of Value Added in Financial Statements).
distribuição do valor adicionado
dva 2013


 Tell a friend